Unraveling the Mystery of East Greenland's Seismic Signals

This article has been meticulously reviewed in accordance with Science X's rigorous editorial process and policies, ensuring the content's credibility and integrity. Editors have emphasized the following attributes that underline the article's quality:
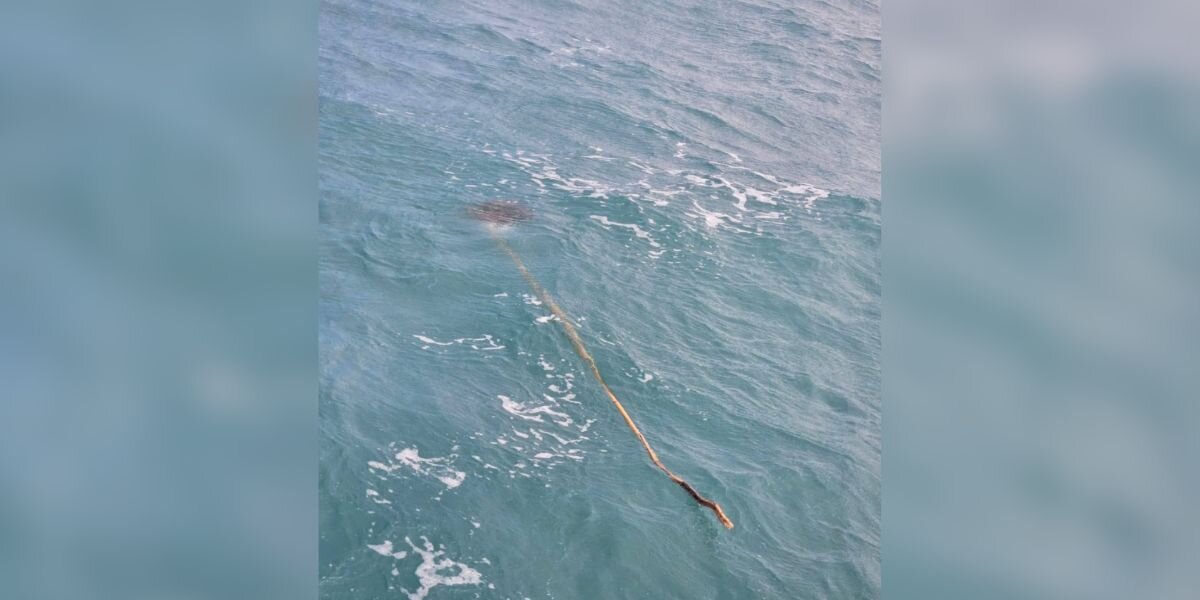
A captivating Copernicus Sentinel-2 satellite image captures the serene yet enigmatic Dickson Fjord in East Greenland. The photograph, credited to researcher Thomas Monahan, serves as a backdrop to a story that has intrigued scientists worldwide.
In September 2023, a peculiar seismic phenomenon was detected globally, characterized by rhythmic signals emanating every 90 seconds over the span of nine days. This extraordinary pattern was subsequently repeated a month later, prompting researchers to delve deeper into its origins. Nearly a year later, two separate scientific studies proposed that these seismic anomalies were actually the result of two massive tsunamis triggered by significant landslides in a remote fjord of East Greenland. These landslides were attributed to the melting of an unnamed glacier, a direct consequence of climate change.
The tsunamis created waves that became trapped within the fjord system, subsequently forming standing waves, known as seiches, that oscillated back and forth. These persistent movements were believed to be responsible for the bizarre seismic signals recorded by instruments around the globe.
However, until recently, there had been no direct observations of these seiches to substantiate the theory. Even a Danish military vessel that entered the fjord just three days after the first seismic event did not detect any evidence of the wave that was effectively shaking the Earth.
In a groundbreaking new study, researchers from Oxford University employed innovative analytical techniques to interpret satellite altimetry data effectively. This technology is pivotal in measuring the Earth's surface, including ocean levels, by recording the time it takes for a radar pulse to travel from a satellite to the Earth's surface and back. This research has been published in the prestigious journal, Nature Communications.
Traditionally, satellite altimeters have struggled to capture evidence of such waves due to their lengthy observational intervals and the limitation of providing one-dimensional profiles directly beneath the satellite. This inherent limitation has made it challenging to discern the necessary differences in water height that would indicate the presence of these significant waves.
For this study, researchers tapped into data from the newly launched Surface Water Ocean Topography (SWOT) satellite, which was sent into orbit in December 2022. SWOT is designed to map water height across 90% of the Earth’s surface.
Central to SWOT's capabilities is the advanced Ka-band Radar Interferometer (KaRIn) instrument. This state-of-the-art device features two antennas mounted on a 10-meter boom extending on either side of the satellite. Through sophisticated techniques, these antennas collaborate to triangulate the return signals from the radar pulse, allowing scientists to measure ocean and surface water levels with unprecedented precision—up to 2.5 meters in resolution across a 30-mile (50-kilometer) wide swath of ocean.
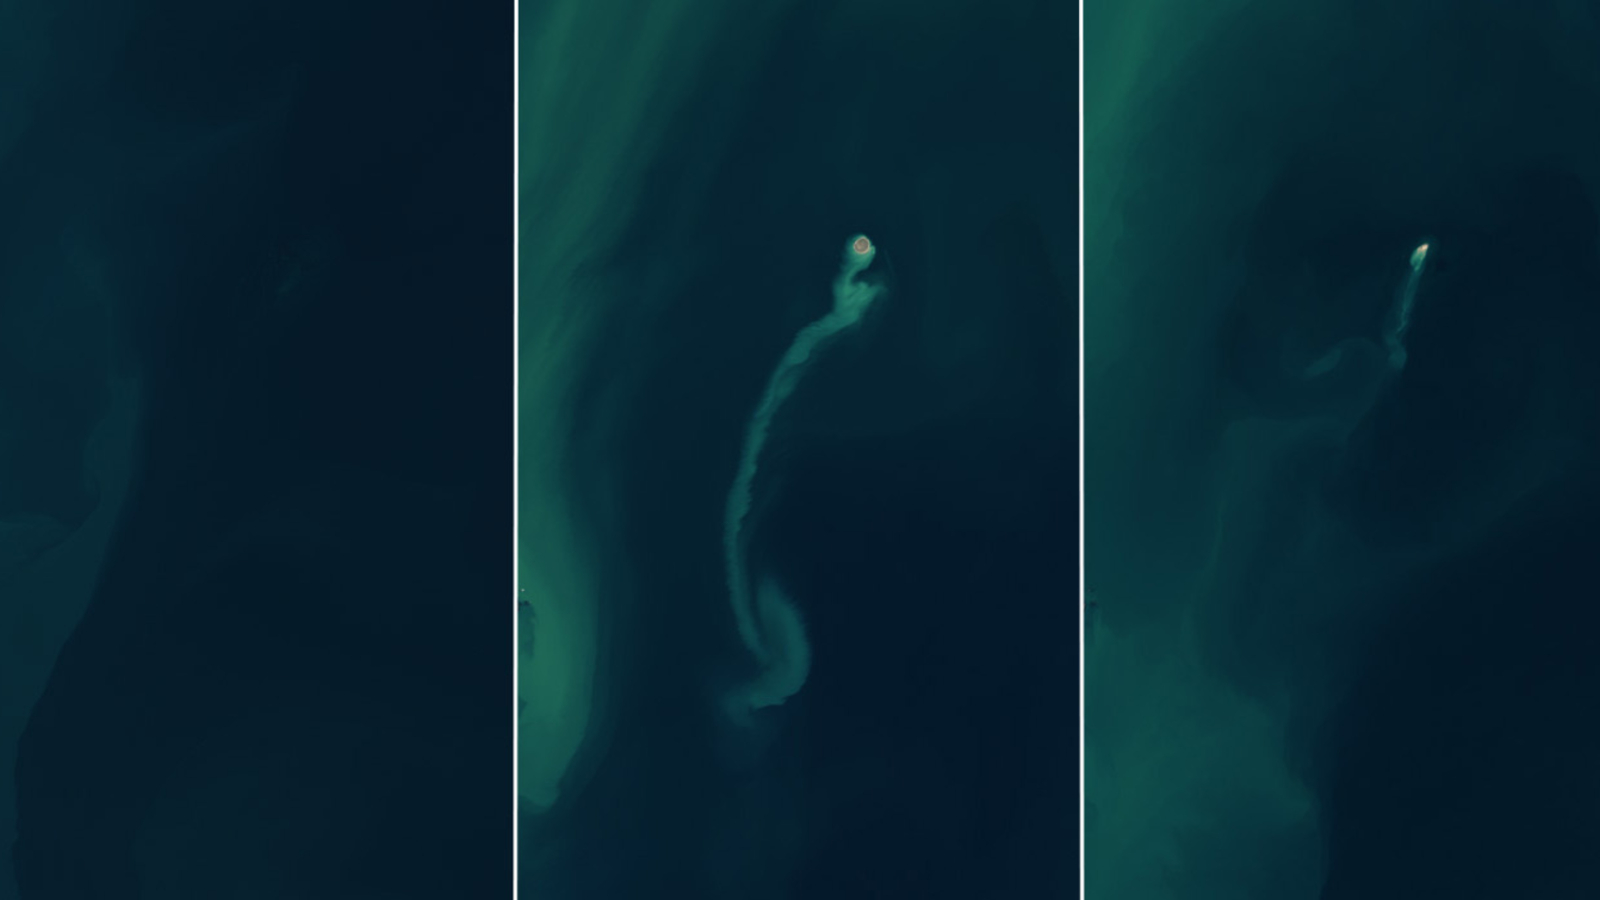
Utilizing the data from the KaRIn instrument, researchers constructed elevation maps of the Greenland Fjord at various intervals following the occurrence of the two tsunamis. These maps unveiled distinct cross-channel slopes with height variances of up to two meters. Notably, the slopes displayed opposite directional movements, indicating that water was indeed shifting back and forth across the fjord channel.
To validate their findings, the researchers correlated these observations with subtle movements in the Earth's crust that were measured thousands of kilometers away. This connection enabled them to reconstruct the wave characteristics, even during periods when the satellite had not been actively observing. Additionally, the researchers analyzed weather and tidal conditions to confirm that these observations could not be attributed to environmental factors like winds or tides.
Lead author Thomas Monahan, a DPhil student at the Department of Engineering Science at the University of Oxford, commented, "Climate change is ushering in new, previously unseen extremes. These extremes are evolving most rapidly in remote regions such as the Arctic, where our capacity to measure them using conventional sensors is quite limited. This study exemplifies how we can harness the next generation of satellite earth observation technologies to explore these phenomena more comprehensively."
Co-author Professor Thomas Adcock, also from the Department of Engineering Science at Oxford, added, "This study is a shining example of how next-generation satellite data can elucidate phenomena that have long remained a mystery. With this technology, we will derive new insights into oceanic extremes such as tsunamis, storm surges, and freak waves. However, to maximize the potential of these data, we must innovate and integrate machine learning alongside our understanding of ocean physics to interpret our findings effectively."
For further information, readers can refer to the original study titled "Observations of the seiche that shook the world" published in Nature Communications (2025). The DOI for the publication is 10.1038/s41467-025-59851-7, and it can be accessed at
Robert Jackson