Scientists Stunned by Groundbreaking Earthquake Footage – What The Video Reveals Will Shock You!
Have you ever witnessed rocks literally dance beneath the earth's surface? Well, buckle up because a recent viral video from Myanmar does just that!
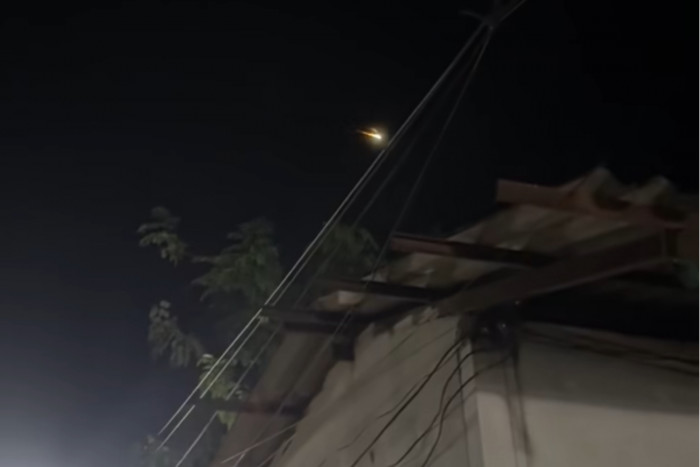
Dramatic CCTV footage showcasing a large earthquake in Myanmar captivated viewers and scientists alike when it was uploaded to YouTube. Geophysicist Jesse Kearse, who viewed the video multiple times, discovered something extraordinary that could change how we understand earthquakes forever.
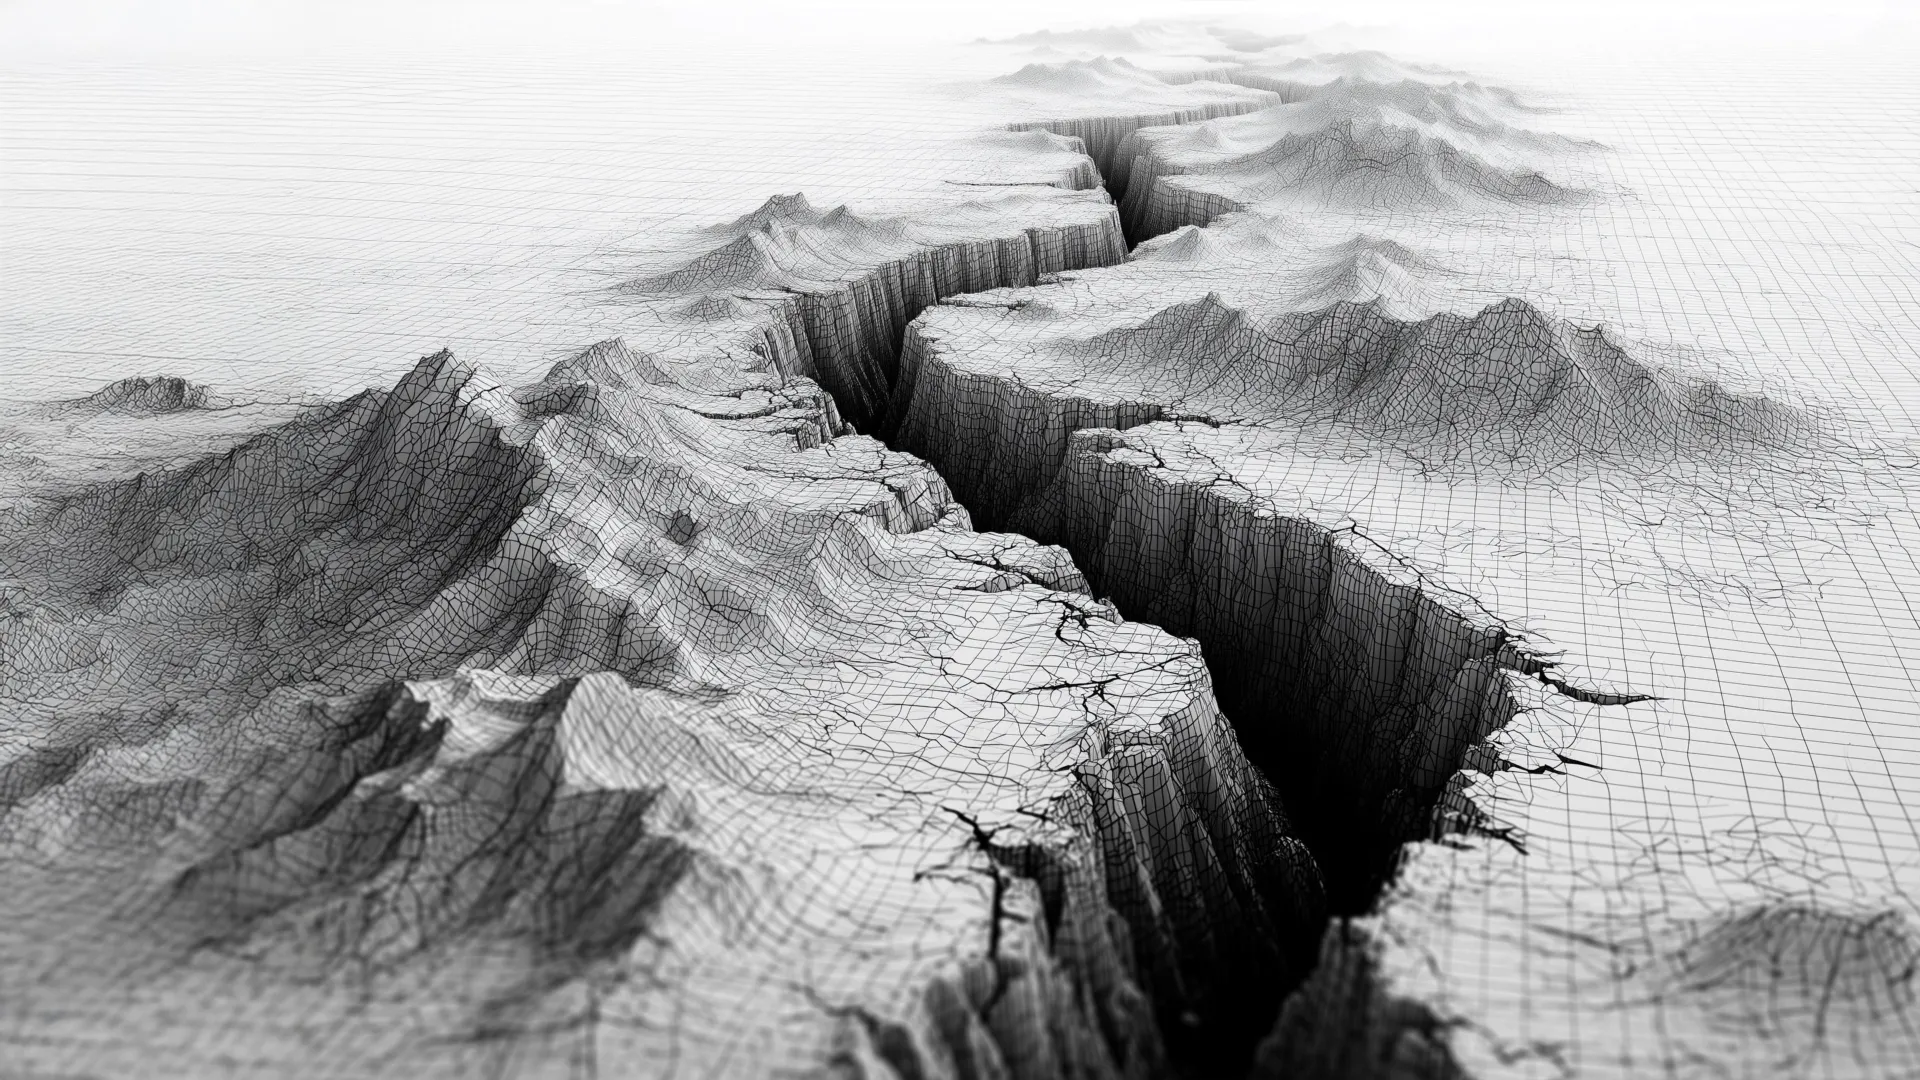
The footage, taken along the trace of the Sagaing Fault during a magnitude 7.7 earthquake on March 28, presents what Kearse and his colleague, Yoshihiro Kaneko from Kyoto University, believe to be the first direct visual evidence of curved fault slip. While earthquake geologists have long observed curved slickenlines – those tell-tale scrape marks left on rocks due to their movement – visual proof of this phenomenon was elusive until now.
Thanks to this astonishing video, researchers can now develop more sophisticated models to analyze how faults rupture, according to Kearse and Kaneko’s findings published in The Seismic Record. The CCTV camera capturing this mesmerizing event was positioned about 20 meters east of the fault, approximately 120 kilometers away from the earthquake's hypocenter.
What unfolds in the video is nothing short of breathtaking. As the quake strikes, viewers can see the land on the western side of the fault shift dramatically northward. Kearse recalls the moment he watched the video for the first time, stating, “It sent chills down my spine straight away. It shows something that I think every earthquake scientist has been desperate to see, and it was just right there, so very exciting.”
As Kearse continued to analyze the video, he noticed something even more intriguing. Unlike the typical linear movement that one might expect, objects in the footage moved along a curved path with a downward convexity. This revelation rang a bell for Kearse, who had previously studied the curvature of fault slip through geological records.
With the Myanmar video in hand, Kearse and Kaneko set out to quantify the movement more meticulously. They employed a technique known as pixel cross-correlation, meticulously tracking the movement frame by frame to extract objective and quantitative data from the video. Their analysis revealed that the fault slipped approximately 2.5 meters in around 1.3 seconds, achieving a peak velocity of about 3.2 meters per second. This pulse-like behavior is a significant discovery, reinforcing previous assumptions made from seismic waveforms of other earthquakes.
Interestingly, they found that most of the fault's motion was strike-slip, accompanied by a brief dip-slip component. The slip curved rapidly at first as it accelerated to its maximum speed, then gradually transitioned to a linear path as it decelerated.
According to Kearse, this pattern aligns with hypotheses suggesting that slip curvature may arise partly because the stresses on the fault near the surface are relatively low. “The dynamic stresses of the earthquake as it's approaching and begins to rupture the fault near the ground surface can induce an obliquity in the fault movement,” he explained.
As the researchers delve deeper, they discovered that the type of slip curvature – whether it curves one way or the other – is influenced by the direction of the rupture. This aligns with the north-south rupture observed during the Myanmar earthquake. Consequently, these slickenlines may provide valuable insights into the dynamics of past earthquakes, helping scientists better understand seismic risks in the future.